NSCLC and BRCA CAFs
Chrysa Papadopoulou
Last updated: 2024-11-05
Checks: 7 0
Knit directory: CCL19_FRCs_lung_cancer/
This reproducible R Markdown analysis was created with workflowr (version 1.7.1). The Checks tab describes the reproducibility checks that were applied when the results were created. The Past versions tab lists the development history.
Great! Since the R Markdown file has been committed to the Git repository, you know the exact version of the code that produced these results.
Great job! The global environment was empty. Objects defined in the global environment can affect the analysis in your R Markdown file in unknown ways. For reproduciblity it’s best to always run the code in an empty environment.
The command set.seed(20240808) was run prior to running
the code in the R Markdown file. Setting a seed ensures that any results
that rely on randomness, e.g. subsampling or permutations, are
reproducible.
Great job! Recording the operating system, R version, and package versions is critical for reproducibility.
Nice! There were no cached chunks for this analysis, so you can be confident that you successfully produced the results during this run.
Great job! Using relative paths to the files within your workflowr project makes it easier to run your code on other machines.
Great! You are using Git for version control. Tracking code development and connecting the code version to the results is critical for reproducibility.
The results in this page were generated with repository version 1014aa0. See the Past versions tab to see a history of the changes made to the R Markdown and HTML files.
Note that you need to be careful to ensure that all relevant files for
the analysis have been committed to Git prior to generating the results
(you can use wflow_publish or
wflow_git_commit). workflowr only checks the R Markdown
file, but you know if there are other scripts or data files that it
depends on. Below is the status of the Git repository when the results
were generated:
Ignored files:
    Ignored:    .DS_Store
    Ignored:    analysis/.DS_Store
    Ignored:    data/Final_submission/
    Ignored:    data/Human/
    Ignored:    data/Mouse/
    Ignored:    data/Public/
    Ignored:    output/GSEA_AdvFB_SULF1/
    Ignored:    output/GSEA_AdvFB_TLS/
    Ignored:    output/GSEA_CCR7_T/
    Ignored:    output/GSEA_CD8_T/
    Ignored:    output/GSEA_CYCL_T/
    Ignored:    output/GSEA_EXH_T/
    Ignored:    output/GSEA_SMC_PRC/

Untracked files:
    Untracked:  README.html
    Untracked:  analysis/.h5seurat
    Untracked:  analysis/Compare_tumors.Rmd
    Untracked:  analysis/NSCLC_PDAC_CAFs.Rmd
    Untracked:  analysis/Seurat_to_SCE.Rmd
    Untracked:  analysis/compression.Rmd
    Untracked:  analysis/index_hidden.Rmd
Note that any generated files, e.g. HTML, png, CSS, etc., are not included in this status report because it is ok for generated content to have uncommitted changes.
These are the previous versions of the repository in which changes were
made to the R Markdown (analysis/NSCLC_vs_BRCA_CAFs.Rmd)
and HTML (docs/NSCLC_vs_BRCA_CAFs.html) files. If you’ve
configured a remote Git repository (see ?wflow_git_remote),
click on the hyperlinks in the table below to view the files as they
were in that past version.
| File | Version | Author | Date | Message |
|---|---|---|---|---|
| Rmd | 1014aa0 | Pchryssa | 2024-11-05 | Correct figure ordering |
| html | a302606 | Pchryssa | 2024-09-23 | Build site. |
| Rmd | 20be992 | Pchryssa | 2024-09-23 | Add NSCLC and BRCA CAFss |
| html | c767554 | Pchryssa | 2024-09-23 | Build site. |
| Rmd | e8aebaf | Pchryssa | 2024-09-23 | Modify figure order |
Load packages
suppressPackageStartupMessages({
  library(here)
  library(purrr)
  library(dplyr)
  library(stringr)
  library(patchwork)
  library(Seurat)
  library(Matrix)
  library(dittoSeq)
  library(gridExtra)
  library(gsubfn)
  library(ggsci)
  library(bigmds)
  library(tidyverse)
})
Comparison between NSCLC CCL19⁺ FRCs, NSCLC CCL19⁺ CAFs and BRCA CAFs
NSCLC CCL19⁺ FRCs and NSCLC CCL19⁺ CAFs
Set directory
basedir <- here()Read CCL19 FRC data
NSCLC_CCL19_data <- readRDS(paste0(basedir,"/data/Human/NSCLC_CCL19_FRCs_CAFs.rds"))Read NSCLC CCL19⁺ TRC PRC data
NSCLC_CCL19_TRC_PRC <- readRDS(paste0(basedir,"/data/Human/NSCLC_CCL19_TRC_PRC_CAFs.rds"))Define color palette
palet <- c("#1B9E77", "#54B0E4","#E3BE00", "#E41A1C")
names(palet) <- c("CAF2/TRC","CAF1/PRC","AdvFB" ,"SMC/PC")
Dotplot with apCAF, iCAF and myCAF gene signatures (Supplementary Figure 2C)
data_conv <-NSCLC_CCL19_TRC_PRC
data_conv <-Remove_ensebl_id(data_conv)

CAF_subsets <- list("iCAF genes"= c("EFEMP1","IL6","C3","CFD","CLU","CXCL12","TNXB",
                                    "HAS1","PLA2G2A","GSN","PCOLCE2","CD34","LEPR",
                                    "CXCL14","CCL2","ADH1B","GPC3","VCAM1","TNC","ALDH1A2"),
                     "apCAF genes" = c("CD74","HLA-DRB1","HLA-DRA","HLA-DQB1"),
                    "myCAF genes"=c("FAP","POSTN","LRRC15","MMP11","COL10A1","COMP","COL8A1","GREM1","SULF1","COL13A1",
                    "COL5A2","LRRC17","COL12A1","THBS2","GJB2","ACTA2","MYH11","ACTG2","DES","COL4A6","BCAM",
                    "RGS5","MCAM","COL4A1","COL18A1","LAMC3","ARHGDIB"))

DotPlot(object = data_conv, features=CAF_subsets,group.by = "cell_type" ,scale=FALSE,dot.scale = 4) +  theme(strip.placement = "outside") +
  theme(axis.text.x = element_text(angle = 90,hjust = 1,colour = NULL,face="bold"),axis.title.x.top=element_text(hjust = 1,face="bold")) +xlab(" ")+ylab(" ")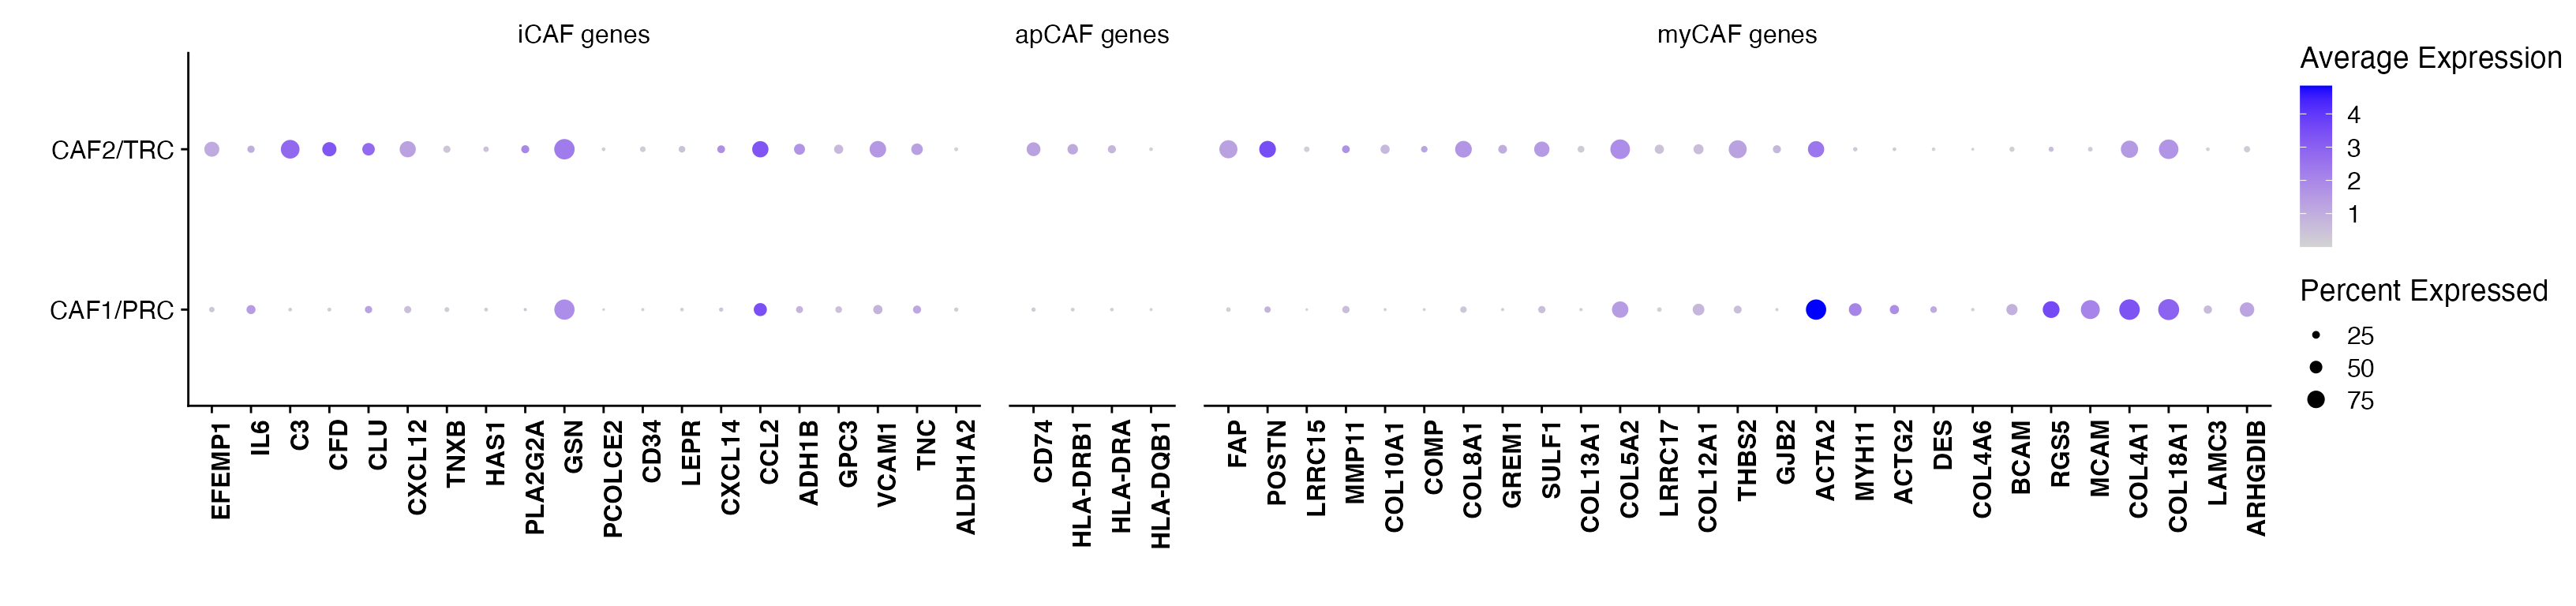
| Version | Author | Date |
|---|---|---|
| c767554 | Pchryssa | 2024-09-23 |
CAF Signatures (Supplementary Figure 2D)
apCAF signature
apCAF_genes <-c("CD74","HLA-DRB1","HLA-DRA","HLA-DQB1")

#Get full gene name (together with the ensembl id)
apCAF_genes <- unlist(lapply(apCAF_genes, function(x) {
  get_full_gene_name(x,NSCLC_CCL19_data)
}))

slot_type <-"data"
gn <- "apCAF"
Visualize_GeneSignatures_sc(NSCLC_CCL19_data, apCAF_genes, slot_type, 'average.mean',gn) + ggtitle("apCAF signature")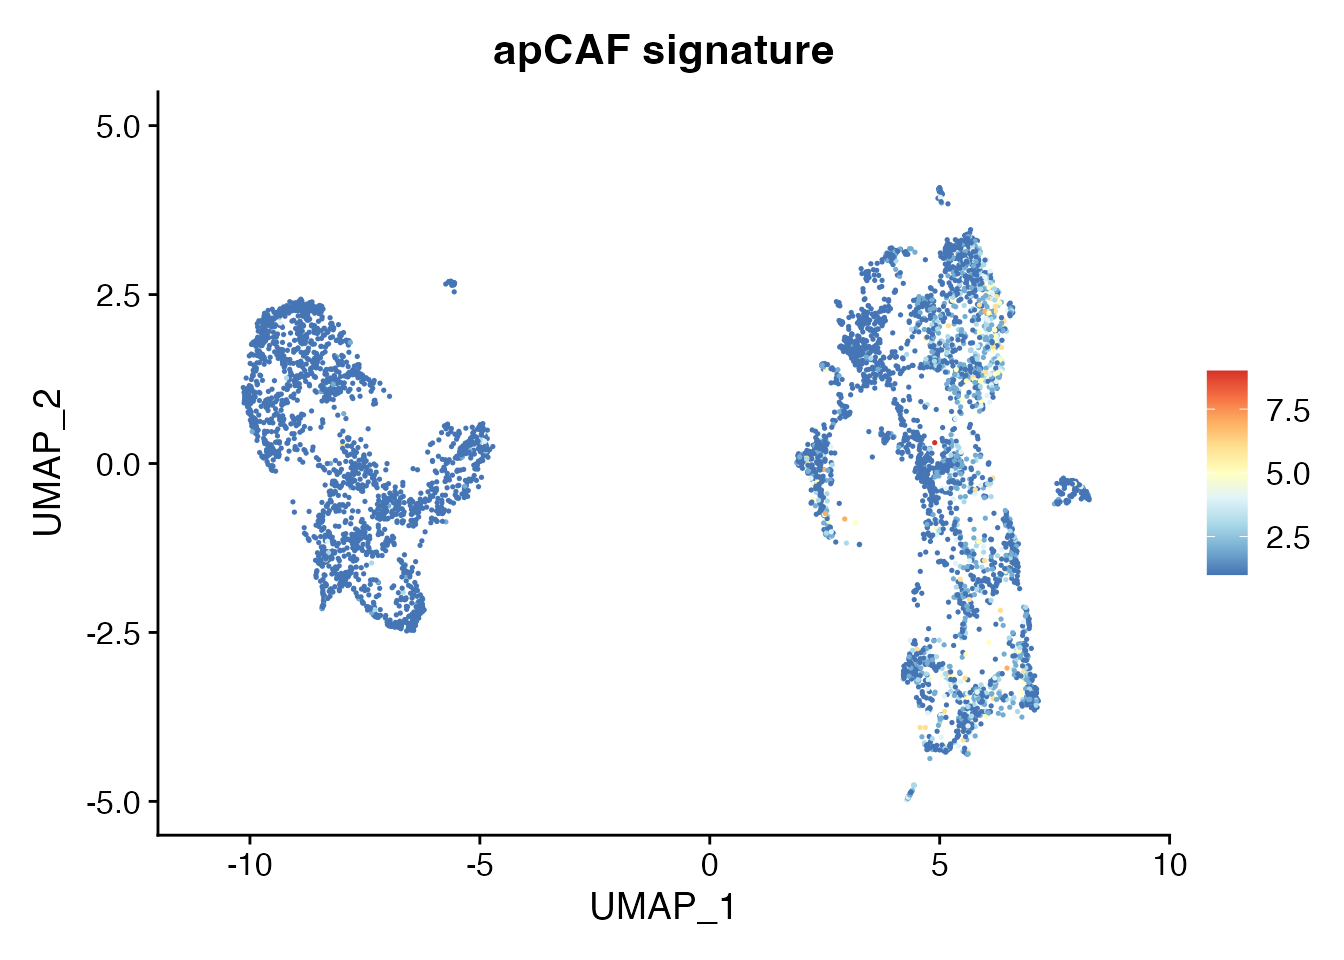
| Version | Author | Date |
|---|---|---|
| c767554 | Pchryssa | 2024-09-23 |
iCAF signature
iCAF_genes <-c("EFEMP1","IL6","C3","CFD","CLU","CXCL12","TNXB","HAS1","PLA2G2A","GSN","PCOLCE2","CD34","LEPR","CXCL14","CCL2","ADH1B","GPC3","VCAM1","TNC","ALDH1A2")

#Get full gene name (together with the ensembl id)
iCAF_genes <- unlist(lapply(iCAF_genes, function(x) {
  get_full_gene_name(x,NSCLC_CCL19_data)
}))

slot_type <-"data"
gn <- "iCAF"
Visualize_GeneSignatures_sc(NSCLC_CCL19_data, iCAF_genes, slot_type, 'average.mean',gn) + ggtitle("iCAF signature")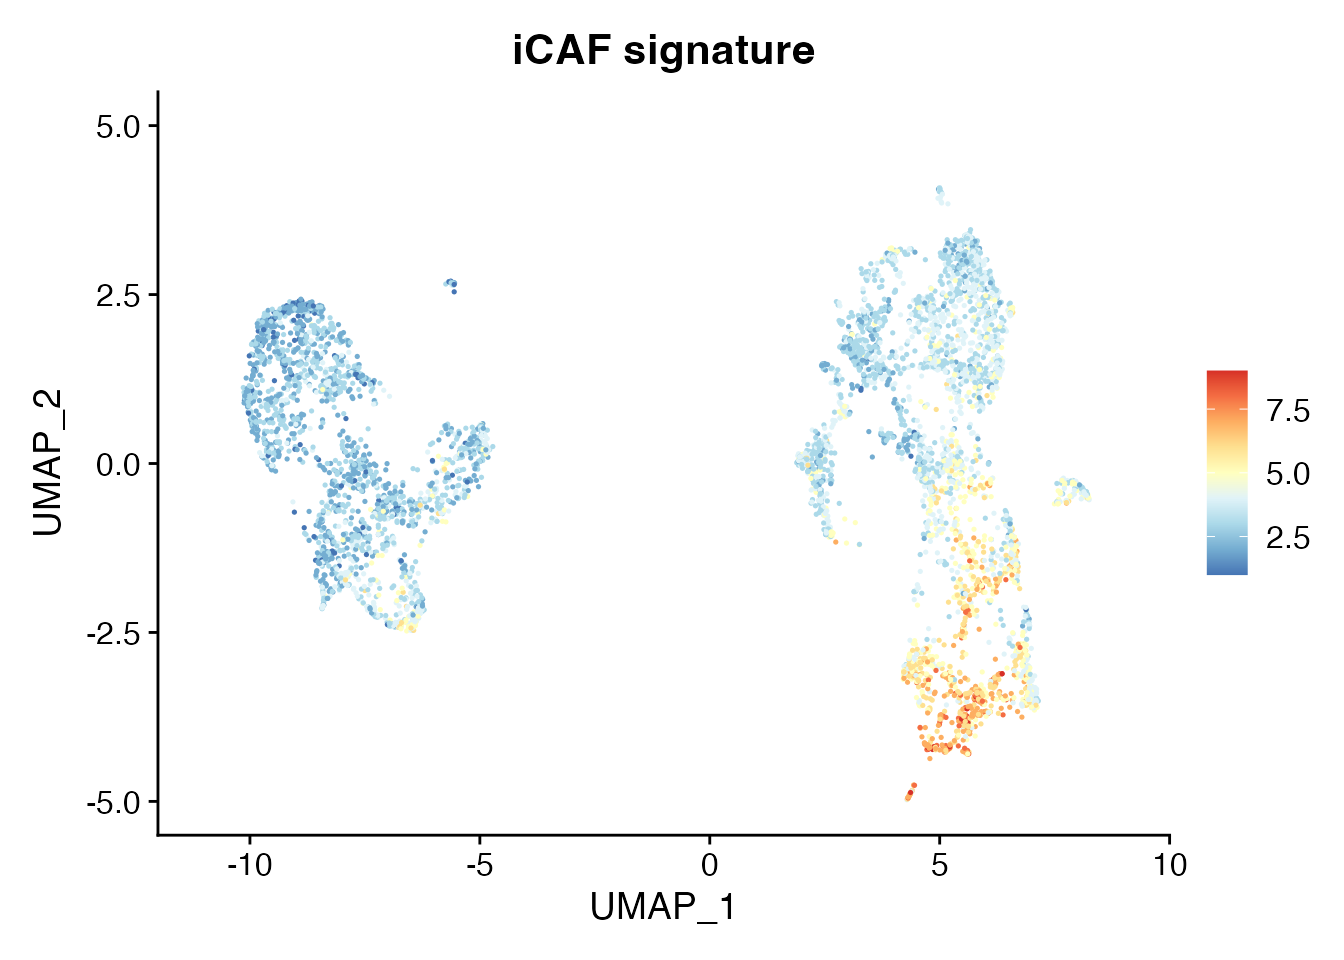
| Version | Author | Date |
|---|---|---|
| c767554 | Pchryssa | 2024-09-23 |
myCAF signature
myCAF_genes <-c("FAP","POSTN","LRRC15","Mmp11","COL10A1","COMP","COL8A1","GREM1","SULF1","COL13A1","COL5A2","LRRC17","COL12A1","Thbs2","GJB2","ACTA2","MYH11","ACTG2","DES","COL4A6","BCAM","RGS5","MCAM","COL4A1","COL18A1","LAMC3","ARHGDIB")

#Get full gene name (together with the ensembl id)
myCAF_genes <- unlist(lapply(myCAF_genes, function(x) {
  get_full_gene_name(x,NSCLC_CCL19_data)
}))

slot_type <-"data"
gn <- "myCAF"
Visualize_GeneSignatures_sc(NSCLC_CCL19_data, myCAF_genes, slot_type, 'average.mean',gn) + ggtitle("myCAF signature")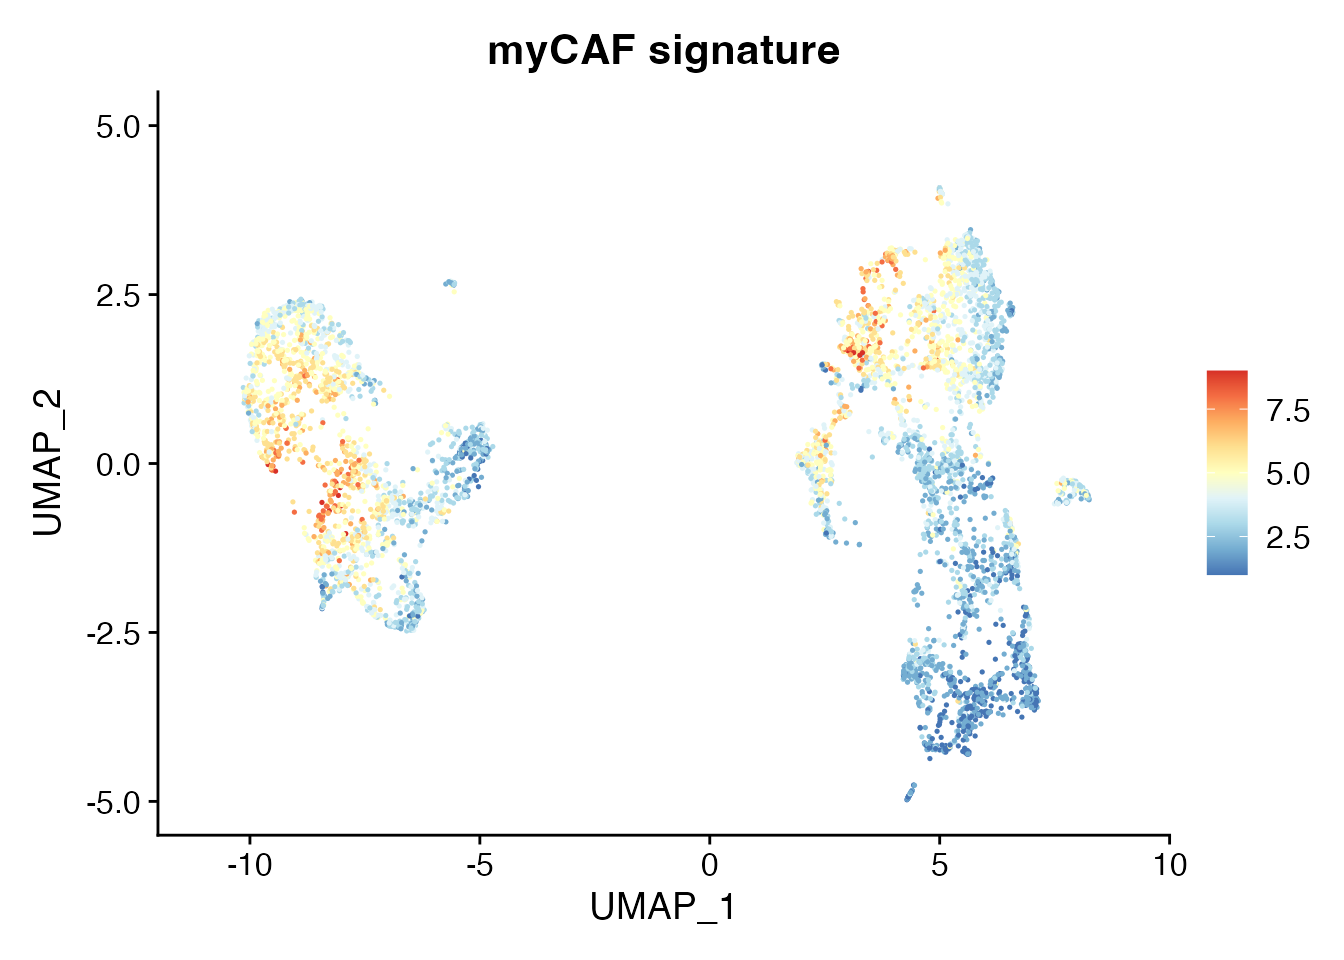
| Version | Author | Date |
|---|---|---|
| c767554 | Pchryssa | 2024-09-23 |
BRCA (breast cancer) CAFs
Read BRCA data from Cords et al, 2023
data_breast <- readRDS(paste0(basedir,"/data/Public/BREAST_fibro_tumour.rds"))Define color palette
cols<- pal_igv()(51)
names(cols) <- c(0:50)
CAF annotation
DimPlot(data_breast, reduction = "umap", group.by = "CAFtype")+
  theme_bw() +
  theme(axis.text = element_blank(), axis.ticks = element_blank(),
        panel.grid.minor = element_blank(),
        panel.grid.major = element_blank()) +
  xlab("UMAP1") +
  ylab("UMAP2") + ggtitle(paste0("CAFs in breast cancer"))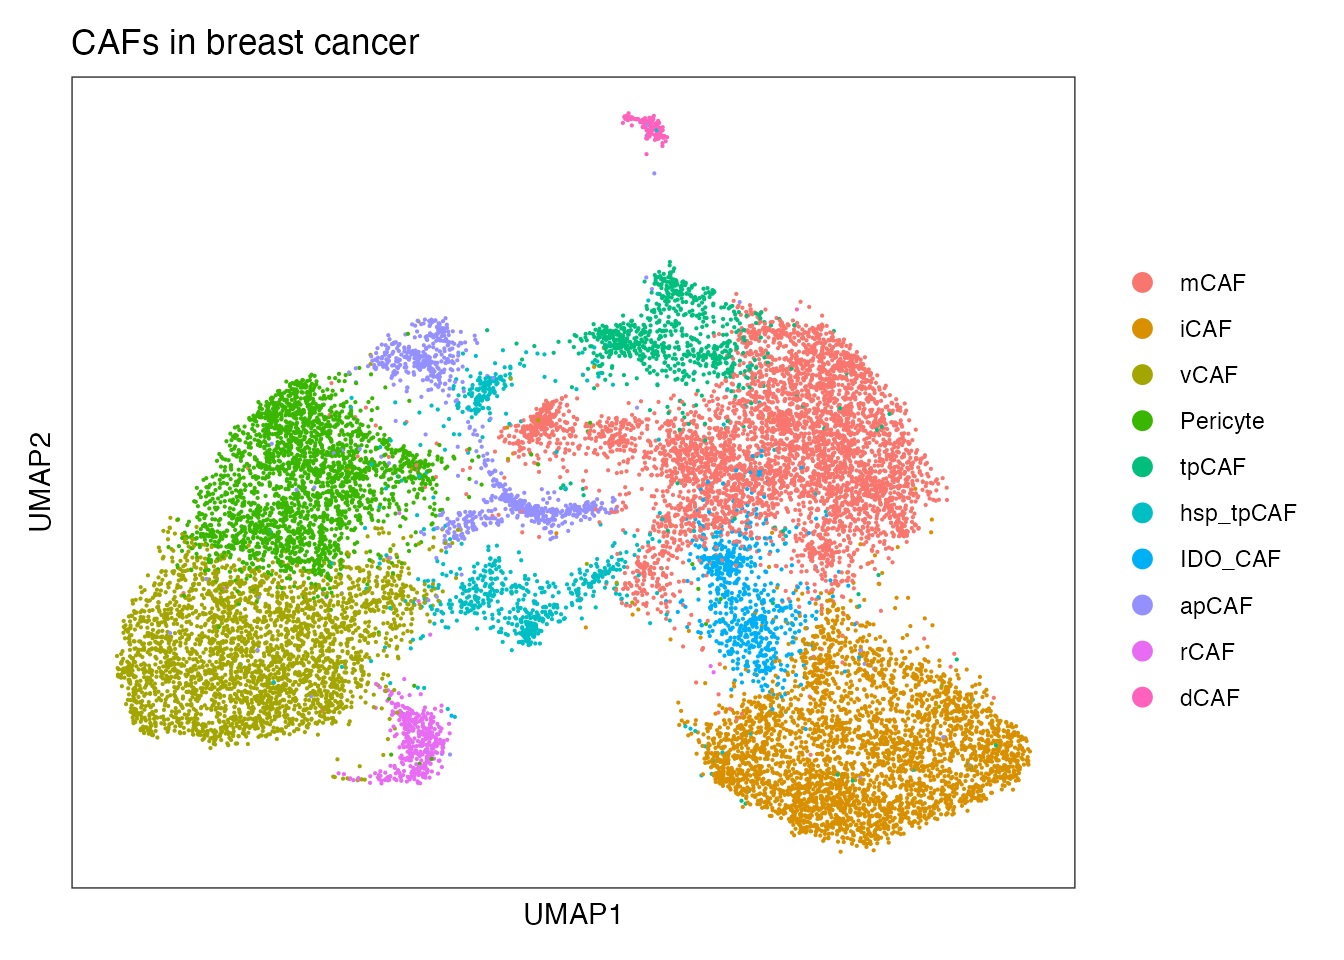
| Version | Author | Date |
|---|---|---|
| a302606 | Pchryssa | 2024-09-23 |
Signatures related to SLOs (Supplementary Figure 2E)
CCL19
FeaturePlot(data_breast, reduction = "umap",
          features = "CCL19",
          cols=c("lightgrey", "darkred")) + ggtitle("CAF (BRCA)")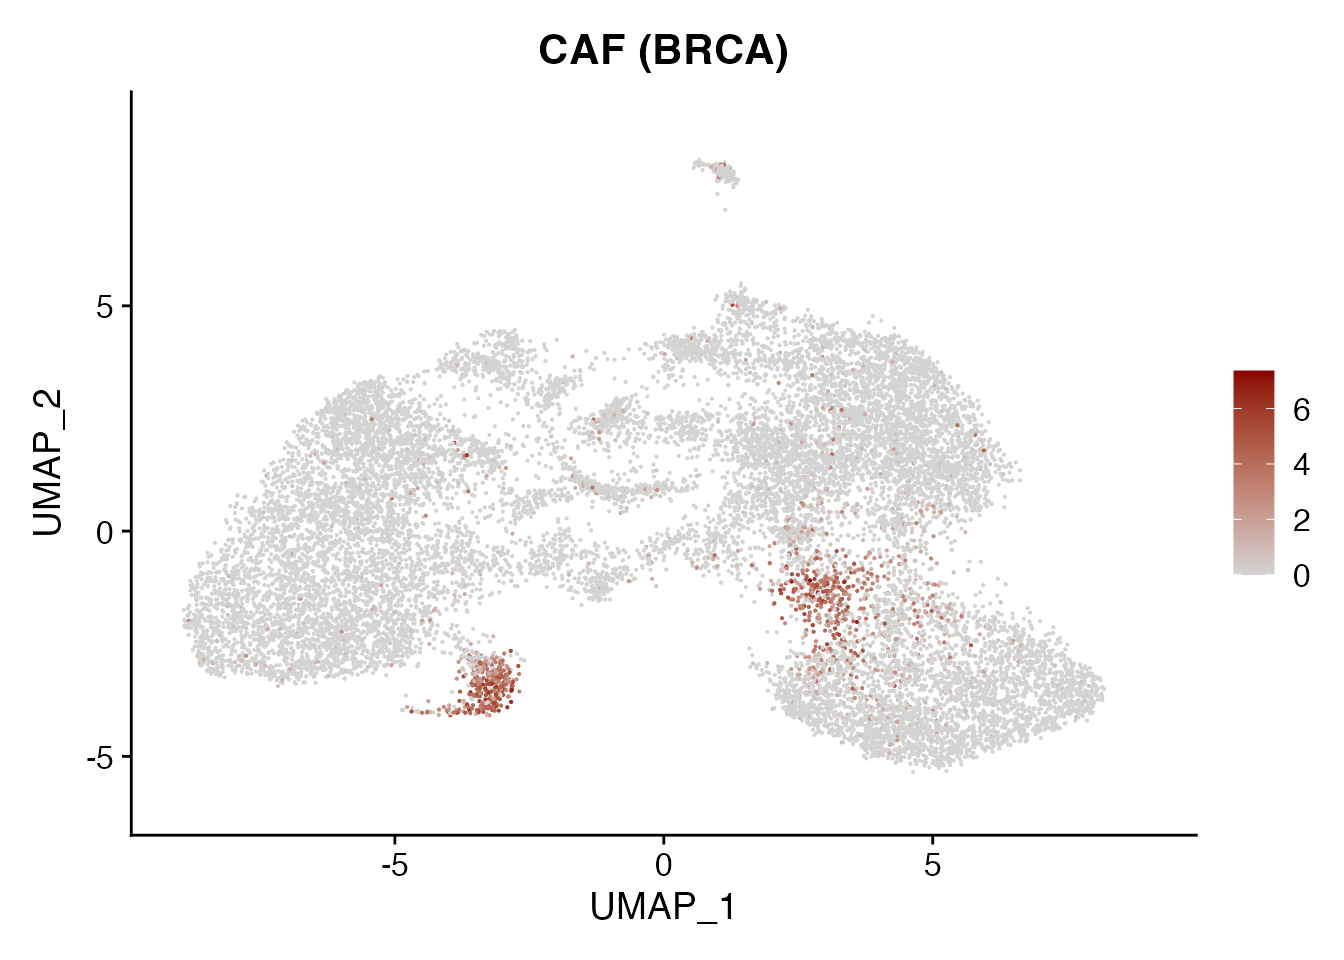
| Version | Author | Date |
|---|---|---|
| a302606 | Pchryssa | 2024-09-23 |
Subset on CCL19⁺ cells
ccl19_data<-subset(x=data_breast,subset=CCL19>0, invert=FALSE)


resolution <- c(0.1, 0.25, 0.4, 0.5,0.6,0.8, 1.,1.2,1.4,1.6,1.8,2.)

# run sctransform
ccl19_data  <- SCTransform(ccl19_data, vars.to.regress = "percent.mt", verbose = FALSE)
ccl19_data <- RunPCA(object = ccl19_data, assay = "SCT",npcs = 30, verbose = FALSE,seed.use = 8734)
ccl19_data <- RunTSNE(object = ccl19_data, assay = "SCT",reduction = "pca", dims = 1:20, seed.use = 8734)
ccl19_data <- RunUMAP(object = ccl19_data, assay = "SCT", reduction = "pca", dims = 1:20, seed.use = 8734)
ccl19_data <- FindNeighbors(object = ccl19_data, reduction = "pca", dims = 1:20, seed.use = 8734)
for(k in 1:length(resolution)){
  ccl19_data <- FindClusters(object = ccl19_data, resolution = resolution[k], random.seed = 8734)
}
Modularity Optimizer version 1.3.0 by Ludo Waltman and Nees Jan van Eck
Number of nodes: 1500
Number of edges: 52230
Running Louvain algorithm...
Maximum modularity in 10 random starts: 0.9373
Number of communities: 3
Elapsed time: 0 seconds
Modularity Optimizer version 1.3.0 by Ludo Waltman and Nees Jan van Eck
Number of nodes: 1500
Number of edges: 52230
Running Louvain algorithm...
Maximum modularity in 10 random starts: 0.8787
Number of communities: 5
Elapsed time: 0 seconds
Modularity Optimizer version 1.3.0 by Ludo Waltman and Nees Jan van Eck
Number of nodes: 1500
Number of edges: 52230
Running Louvain algorithm...
Maximum modularity in 10 random starts: 0.8452
Number of communities: 7
Elapsed time: 0 seconds
Modularity Optimizer version 1.3.0 by Ludo Waltman and Nees Jan van Eck
Number of nodes: 1500
Number of edges: 52230
Running Louvain algorithm...
Maximum modularity in 10 random starts: 0.8278
Number of communities: 9
Elapsed time: 0 seconds
Modularity Optimizer version 1.3.0 by Ludo Waltman and Nees Jan van Eck
Number of nodes: 1500
Number of edges: 52230
Running Louvain algorithm...
Maximum modularity in 10 random starts: 0.8132
Number of communities: 9
Elapsed time: 0 seconds
Modularity Optimizer version 1.3.0 by Ludo Waltman and Nees Jan van Eck
Number of nodes: 1500
Number of edges: 52230
Running Louvain algorithm...
Maximum modularity in 10 random starts: 0.7840
Number of communities: 9
Elapsed time: 0 seconds
Modularity Optimizer version 1.3.0 by Ludo Waltman and Nees Jan van Eck
Number of nodes: 1500
Number of edges: 52230
Running Louvain algorithm...
Maximum modularity in 10 random starts: 0.7553
Number of communities: 9
Elapsed time: 0 seconds
Modularity Optimizer version 1.3.0 by Ludo Waltman and Nees Jan van Eck
Number of nodes: 1500
Number of edges: 52230
Running Louvain algorithm...
Maximum modularity in 10 random starts: 0.7333
Number of communities: 11
Elapsed time: 0 seconds
Modularity Optimizer version 1.3.0 by Ludo Waltman and Nees Jan van Eck
Number of nodes: 1500
Number of edges: 52230
Running Louvain algorithm...
Maximum modularity in 10 random starts: 0.7125
Number of communities: 11
Elapsed time: 0 seconds
Modularity Optimizer version 1.3.0 by Ludo Waltman and Nees Jan van Eck
Number of nodes: 1500
Number of edges: 52230
Running Louvain algorithm...
Maximum modularity in 10 random starts: 0.6937
Number of communities: 13
Elapsed time: 0 seconds
Modularity Optimizer version 1.3.0 by Ludo Waltman and Nees Jan van Eck
Number of nodes: 1500
Number of edges: 52230
Running Louvain algorithm...
Maximum modularity in 10 random starts: 0.6747
Number of communities: 15
Elapsed time: 0 seconds
Modularity Optimizer version 1.3.0 by Ludo Waltman and Nees Jan van Eck
Number of nodes: 1500
Number of edges: 52230
Running Louvain algorithm...
Maximum modularity in 10 random starts: 0.6573
Number of communities: 15
Elapsed time: 0 secondsAnnotate CCL19⁺ breast cancer data
ccl19_data$cell_type <- -1
ccl19_data$cell_type[which(ccl19_data$SCT_snn_res.0.1 == 1)] <- "CAF1/PRC"
ccl19_data$cell_type[which(ccl19_data$SCT_snn_res.0.1 == 0)] <- "CAF2/TRC"
ccl19_data$cell_type[which(ccl19_data$SCT_snn_res.0.1 == 2)] <- "CAF2/TRC"
CCL19⁺ fibroblasts (BRCA) (Supplementary Figure 2F)
palet <- cols[4:10]
names(palet) <- c("CAF1/PRC","CAF2/TRC")

DimPlot(ccl19_data, reduction = "umap", group.by = "cell_type", cols= palet)+
  theme_bw() +
  theme(axis.text = element_blank(), axis.ticks = element_blank(),
        panel.grid.minor = element_blank(),
         panel.grid.major = element_blank()) +
 xlab("UMAP1") +
  ylab("UMAP2") + ggtitle(paste0("CCL19", expression("\u207A"), " fibroblasts (BRCA)"))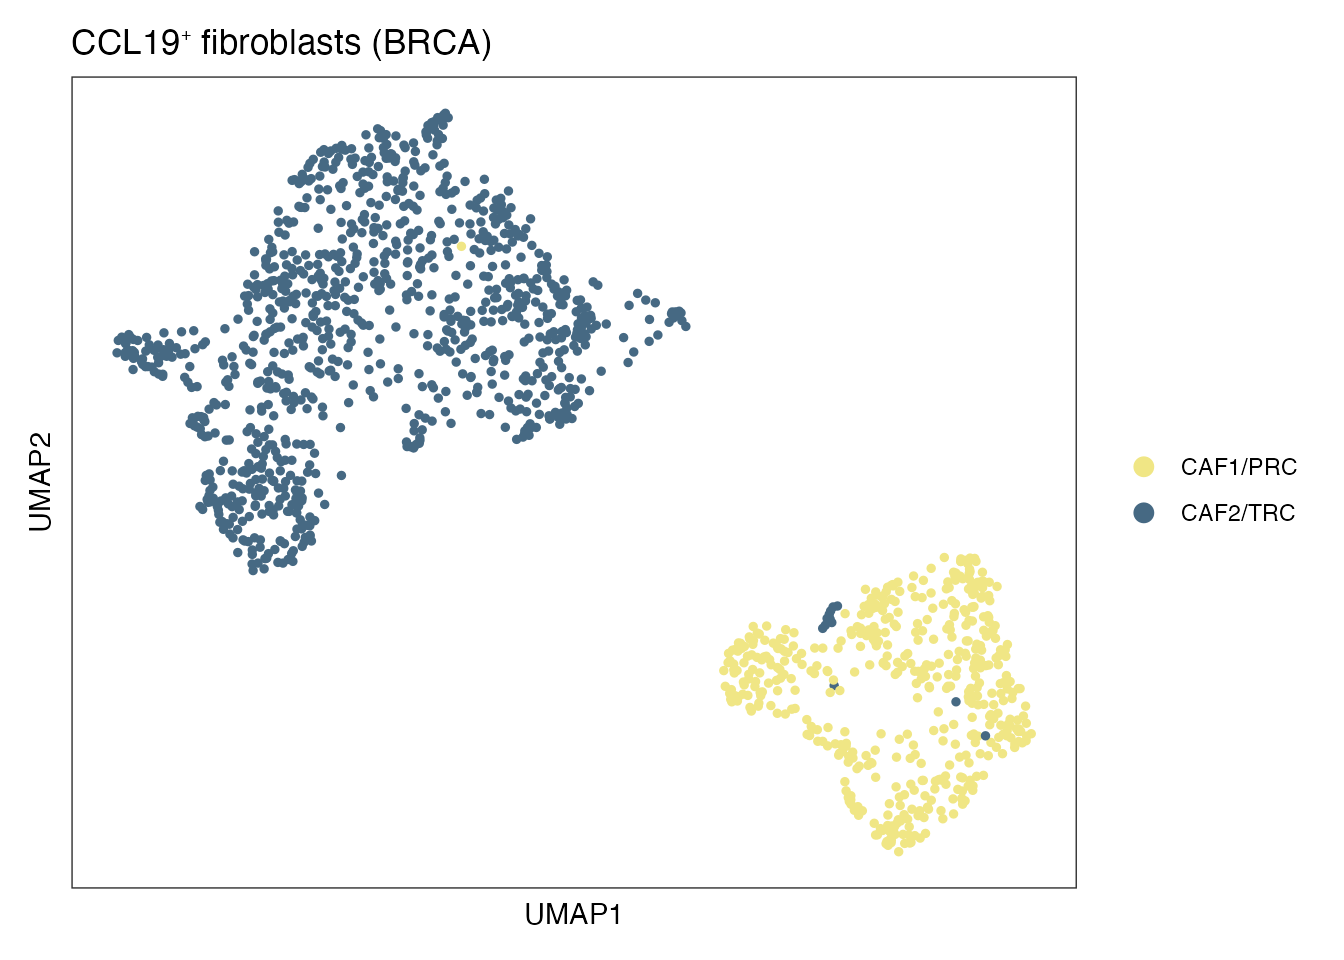
| Version | Author | Date |
|---|---|---|
| a302606 | Pchryssa | 2024-09-23 |
Dotplot (Supplementary Figure 2G)
data_conv <-ccl19_data

Idents(data_conv) <- data_conv$cell_type
levels(data_conv)<-levels(data_conv)[order(match(levels(data_conv),c("CAF1/PRC","CAF2/TRC")))]
data_conv$cell_type <- factor(as.character(data_conv@active.ident), levels = rev(c("CAF1/PRC","CAF2/TRC")))

gene_list <-c("CCL19","CCL21","PDPN","FAP","POSTN","CLU","LEPR","CD34","SULF1","DPT","ICAM1","VCAM1","ACTA2","MYH11","MCAM","NOTCH3","RGS5","DES")

dittoDotPlot(data_conv, vars = gene_list, group.by = "cell_type", size = 8,legend.size.title = "Expression (%)",scale = FALSE, max = 3.5) + ylab(" ")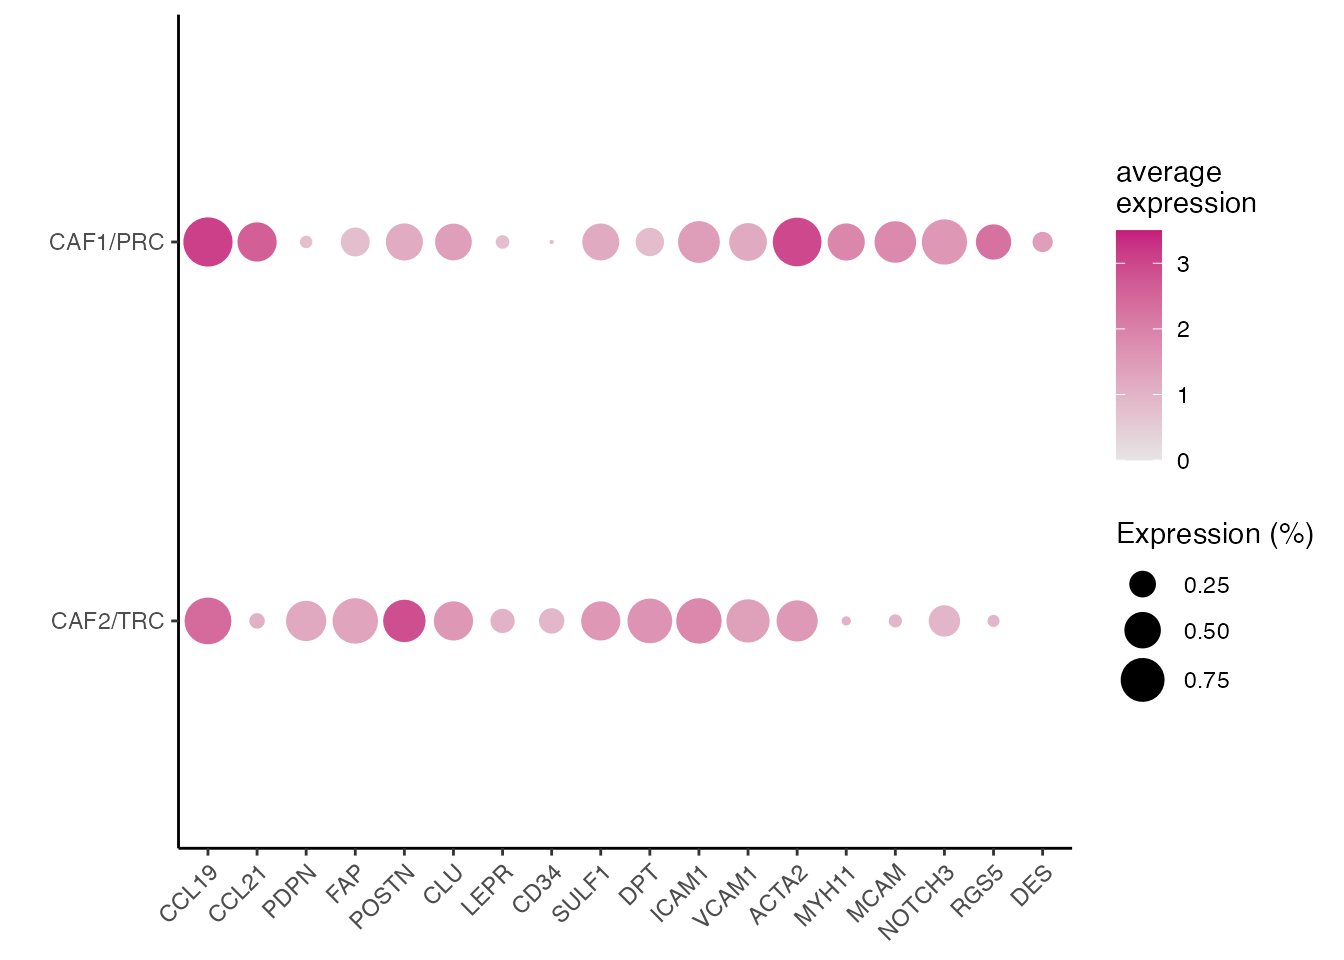
| Version | Author | Date |
|---|---|---|
| a302606 | Pchryssa | 2024-09-23 |
Session info
sessionInfo()R version 4.3.1 (2023-06-16)
Platform: aarch64-apple-darwin20 (64-bit)
Running under: macOS Ventura 13.6.9
Matrix products: default
BLAS: /Library/Frameworks/R.framework/Versions/4.3-arm64/Resources/lib/libRblas.0.dylib
LAPACK: /Library/Frameworks/R.framework/Versions/4.3-arm64/Resources/lib/libRlapack.dylib; LAPACK version 3.11.0
locale:
[1] en_US.UTF-8/en_US.UTF-8/en_US.UTF-8/C/en_US.UTF-8/en_US.UTF-8
time zone: Europe/Zurich
tzcode source: internal
attached base packages:
[1] stats graphics grDevices utils datasets methods base
other attached packages:
[1] lubridate_1.9.2 forcats_1.0.0 readr_2.1.4 tidyverse_2.0.0
[5] bigmds_3.0.0 ggsci_3.0.0 gsubfn_0.7 proto_1.0.0
[9] gridExtra_2.3 dittoSeq_1.12.1 ggplot2_3.4.2 Matrix_1.6-0
[13] SeuratObject_4.1.3 Seurat_4.3.0.1 patchwork_1.1.2 stringr_1.5.0
[17] dplyr_1.1.2 purrr_1.0.1 here_1.0.1 magrittr_2.0.3
[21] circlize_0.4.15 tidyr_1.3.0 tibble_3.2.1 workflowr_1.7.1
loaded via a namespace (and not attached):
[1] RcppAnnoy_0.0.21 splines_4.3.1
[3] later_1.3.1 bitops_1.0-7
[5] polyclip_1.10-4 lifecycle_1.0.3
[7] tcltk_4.3.1 rprojroot_2.0.3
[9] globals_0.16.2 processx_3.8.2
[11] lattice_0.21-8 MASS_7.3-60
[13] plotly_4.10.2 sass_0.4.7
[15] rmarkdown_2.23 jquerylib_0.1.4
[17] yaml_2.3.7 httpuv_1.6.11
[19] sctransform_0.3.5 sp_2.0-0
[21] spatstat.sparse_3.0-2 reticulate_1.36.1
[23] cowplot_1.1.1 pbapply_1.7-2
[25] RColorBrewer_1.1-3 abind_1.4-5
[27] zlibbioc_1.46.0 Rtsne_0.16
[29] GenomicRanges_1.52.0 BiocGenerics_0.46.0
[31] RCurl_1.98-1.12 pracma_2.4.4
[33] git2r_0.33.0 GenomeInfoDbData_1.2.10
[35] IRanges_2.34.1 S4Vectors_0.38.1
[37] ggrepel_0.9.3 svd_0.5.5
[39] irlba_2.3.5.1 listenv_0.9.0
[41] spatstat.utils_3.1-0 pheatmap_1.0.12
[43] goftest_1.2-3 spatstat.random_3.1-5
[45] fitdistrplus_1.1-11 parallelly_1.36.0
[47] leiden_0.4.3 codetools_0.2-19
[49] DelayedArray_0.28.0 tidyselect_1.2.0
[51] shape_1.4.6 farver_2.1.1
[53] matrixStats_1.0.0 stats4_4.3.1
[55] spatstat.explore_3.2-1 jsonlite_1.8.7
[57] ellipsis_0.3.2 progressr_0.13.0
[59] ggridges_0.5.4 survival_3.5-5
[61] systemfonts_1.0.4 tools_4.3.1
[63] ragg_1.2.5 ica_1.0-3
[65] Rcpp_1.0.11 glue_1.6.2
[67] SparseArray_1.2.4 xfun_0.39
[69] MatrixGenerics_1.12.3 GenomeInfoDb_1.36.1
[71] withr_2.5.0 fastmap_1.1.1
[73] fansi_1.0.4 callr_3.7.3
[75] digest_0.6.33 timechange_0.2.0
[77] R6_2.5.1 mime_0.12
[79] textshaping_0.3.6 colorspace_2.1-0
[81] scattermore_1.2 tensor_1.5
[83] spatstat.data_3.0-1 utf8_1.2.3
[85] generics_0.1.3 data.table_1.14.8
[87] httr_1.4.6 htmlwidgets_1.6.2
[89] S4Arrays_1.2.1 whisker_0.4.1
[91] uwot_0.1.16 pkgconfig_2.0.3
[93] gtable_0.3.3 lmtest_0.9-40
[95] SingleCellExperiment_1.22.0 XVector_0.40.0
[97] htmltools_0.5.5 scales_1.2.1
[99] Biobase_2.60.0 png_0.1-8
[101] knitr_1.43 rstudioapi_0.15.0
[103] tzdb_0.4.0 reshape2_1.4.4
[105] nlme_3.1-162 cachem_1.0.8
[107] zoo_1.8-12 GlobalOptions_0.1.2
[109] KernSmooth_2.23-22 parallel_4.3.1
[111] miniUI_0.1.1.1 pillar_1.9.0
[113] grid_4.3.1 vctrs_0.6.3
[115] RANN_2.6.1 promises_1.2.0.1
[117] xtable_1.8-4 cluster_2.1.4
[119] evaluate_0.21 cli_3.6.1
[121] compiler_4.3.1 rlang_1.1.1
[123] crayon_1.5.2 future.apply_1.11.0
[125] labeling_0.4.2 ps_1.7.5
[127] getPass_0.2-4 plyr_1.8.8
[129] fs_1.6.3 stringi_1.7.12
[131] viridisLite_0.4.2 deldir_1.0-9
[133] munsell_0.5.0 lazyeval_0.2.2
[135] spatstat.geom_3.2-4 hms_1.1.3
[137] future_1.33.0 shiny_1.7.4.1
[139] highr_0.10 SummarizedExperiment_1.30.2
[141] ROCR_1.0-11 igraph_1.5.0.1
[143] bslib_0.5.0 date()[1] "Tue Nov 5 21:36:47 2024"
sessionInfo()R version 4.3.1 (2023-06-16)
Platform: aarch64-apple-darwin20 (64-bit)
Running under: macOS Ventura 13.6.9
Matrix products: default
BLAS: /Library/Frameworks/R.framework/Versions/4.3-arm64/Resources/lib/libRblas.0.dylib
LAPACK: /Library/Frameworks/R.framework/Versions/4.3-arm64/Resources/lib/libRlapack.dylib; LAPACK version 3.11.0
locale:
[1] en_US.UTF-8/en_US.UTF-8/en_US.UTF-8/C/en_US.UTF-8/en_US.UTF-8
time zone: Europe/Zurich
tzcode source: internal
attached base packages:
[1] stats graphics grDevices utils datasets methods base
other attached packages:
[1] lubridate_1.9.2 forcats_1.0.0 readr_2.1.4 tidyverse_2.0.0
[5] bigmds_3.0.0 ggsci_3.0.0 gsubfn_0.7 proto_1.0.0
[9] gridExtra_2.3 dittoSeq_1.12.1 ggplot2_3.4.2 Matrix_1.6-0
[13] SeuratObject_4.1.3 Seurat_4.3.0.1 patchwork_1.1.2 stringr_1.5.0
[17] dplyr_1.1.2 purrr_1.0.1 here_1.0.1 magrittr_2.0.3
[21] circlize_0.4.15 tidyr_1.3.0 tibble_3.2.1 workflowr_1.7.1
loaded via a namespace (and not attached):
[1] RcppAnnoy_0.0.21 splines_4.3.1
[3] later_1.3.1 bitops_1.0-7
[5] polyclip_1.10-4 lifecycle_1.0.3
[7] tcltk_4.3.1 rprojroot_2.0.3
[9] globals_0.16.2 processx_3.8.2
[11] lattice_0.21-8 MASS_7.3-60
[13] plotly_4.10.2 sass_0.4.7
[15] rmarkdown_2.23 jquerylib_0.1.4
[17] yaml_2.3.7 httpuv_1.6.11
[19] sctransform_0.3.5 sp_2.0-0
[21] spatstat.sparse_3.0-2 reticulate_1.36.1
[23] cowplot_1.1.1 pbapply_1.7-2
[25] RColorBrewer_1.1-3 abind_1.4-5
[27] zlibbioc_1.46.0 Rtsne_0.16
[29] GenomicRanges_1.52.0 BiocGenerics_0.46.0
[31] RCurl_1.98-1.12 pracma_2.4.4
[33] git2r_0.33.0 GenomeInfoDbData_1.2.10
[35] IRanges_2.34.1 S4Vectors_0.38.1
[37] ggrepel_0.9.3 svd_0.5.5
[39] irlba_2.3.5.1 listenv_0.9.0
[41] spatstat.utils_3.1-0 pheatmap_1.0.12
[43] goftest_1.2-3 spatstat.random_3.1-5
[45] fitdistrplus_1.1-11 parallelly_1.36.0
[47] leiden_0.4.3 codetools_0.2-19
[49] DelayedArray_0.28.0 tidyselect_1.2.0
[51] shape_1.4.6 farver_2.1.1
[53] matrixStats_1.0.0 stats4_4.3.1
[55] spatstat.explore_3.2-1 jsonlite_1.8.7
[57] ellipsis_0.3.2 progressr_0.13.0
[59] ggridges_0.5.4 survival_3.5-5
[61] systemfonts_1.0.4 tools_4.3.1
[63] ragg_1.2.5 ica_1.0-3
[65] Rcpp_1.0.11 glue_1.6.2
[67] SparseArray_1.2.4 xfun_0.39
[69] MatrixGenerics_1.12.3 GenomeInfoDb_1.36.1
[71] withr_2.5.0 fastmap_1.1.1
[73] fansi_1.0.4 callr_3.7.3
[75] digest_0.6.33 timechange_0.2.0
[77] R6_2.5.1 mime_0.12
[79] textshaping_0.3.6 colorspace_2.1-0
[81] scattermore_1.2 tensor_1.5
[83] spatstat.data_3.0-1 utf8_1.2.3
[85] generics_0.1.3 data.table_1.14.8
[87] httr_1.4.6 htmlwidgets_1.6.2
[89] S4Arrays_1.2.1 whisker_0.4.1
[91] uwot_0.1.16 pkgconfig_2.0.3
[93] gtable_0.3.3 lmtest_0.9-40
[95] SingleCellExperiment_1.22.0 XVector_0.40.0
[97] htmltools_0.5.5 scales_1.2.1
[99] Biobase_2.60.0 png_0.1-8
[101] knitr_1.43 rstudioapi_0.15.0
[103] tzdb_0.4.0 reshape2_1.4.4
[105] nlme_3.1-162 cachem_1.0.8
[107] zoo_1.8-12 GlobalOptions_0.1.2
[109] KernSmooth_2.23-22 parallel_4.3.1
[111] miniUI_0.1.1.1 pillar_1.9.0
[113] grid_4.3.1 vctrs_0.6.3
[115] RANN_2.6.1 promises_1.2.0.1
[117] xtable_1.8-4 cluster_2.1.4
[119] evaluate_0.21 cli_3.6.1
[121] compiler_4.3.1 rlang_1.1.1
[123] crayon_1.5.2 future.apply_1.11.0
[125] labeling_0.4.2 ps_1.7.5
[127] getPass_0.2-4 plyr_1.8.8
[129] fs_1.6.3 stringi_1.7.12
[131] viridisLite_0.4.2 deldir_1.0-9
[133] munsell_0.5.0 lazyeval_0.2.2
[135] spatstat.geom_3.2-4 hms_1.1.3
[137] future_1.33.0 shiny_1.7.4.1
[139] highr_0.10 SummarizedExperiment_1.30.2
[141] ROCR_1.0-11 igraph_1.5.0.1
[143] bslib_0.5.0